Confirm Forex Momentum With Heikin Ashi
Investors and speculators are always looking for an edge in determining the strength and direction of trends. The Heikin Ashi application is one tool that may be able to provide this edge. Similar to the Ichimoku charts, the Heikin Ashi has been a relatively unknown tool that has recently seen a rise in popularity, even though it has been accessible since its introduction almost two decades ago.
In addition to showing the relative strength of a trend, the application also notes key turning points in price action and reacts much like a moving average. Incorporating the overall session activity in a single candlestick (open, close, high and low), the charting tool also "smooths" over erratic fluctuations in the currency markets and omits spikes that may be sparked by volatility or jumps in price. This allows chartists to obtain a clearer picture of what's going on in the market and to make a more informed trading decision. Let's take a look at how the Heikin Ashi is calculated and how it can be applied to forex trading. (For more insight, read Heikin-Ashi: A Better Candlestick and Trading Without Noise.)
Defining the Heikin Ashi
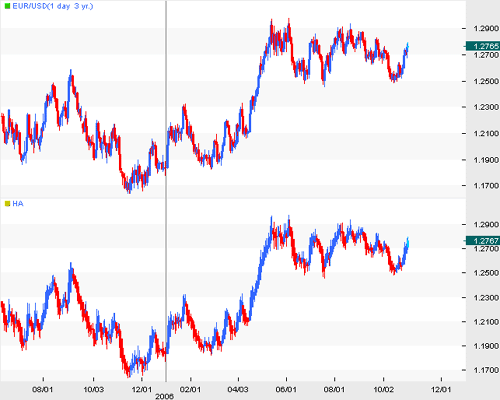
Before we get into the actual application of the Heikin Ashi, let's dive into some logistics involving the real meaning behind it. Usually a type of candlestick chart, the Heikin Ashi is available on some charting packages as a separate indicator. This allows investors or speculators to make a side-to-side comparison between the standard candlestick and the Heikin Ashi, allowing for a more cohesive interpretation. In Figure 1, the chartist can see that the two are very similar but offer different perspectives, as the Heikin Ashi indicator disregards market noise and concentrates on the smoother trend of the underlying price action in the euro/U.S. dollar.
The reason the Heikin Ashi tends to be smoother is because instead of using a simple low and high of the session to calculate individual candles, the Heikin Ashi takes the prices per bar and averages them to create a "smoother" session. This is key because the currency markets tend to offer traders more volatility and market noise in the price than other markets. Here is how each candle is constructed:
•Close = (Open Price + High + Low +Close) / 4
•Open = (Open Price of the previous bar + Close Price of the previous bar) / 2
•High = [Maximum value of the (High, Open, Close)]
•Low = [Minimum value of the (Low, Open, Close)]
By plugging formulas into each individual session to construct consecutive candles, the chart continues to be reflective of the underlying price action, isolating the price and excluding currency market volatility and noise. The resulting picture gives the trader a more visually appealing perspective, and one that can help in identifying the overall trend.
Now that we've established how the candles are calculated, here is how to interpret them:
•Positive candles (blue) containing no wicks: There is strong uptrend momentum in the session and it will likely continue. Here, the trader will have a hands-off approach to profits while strongly considering adding on to the position.
•Positive candles (blue) containing shadows or wicks: Strength continues to support the price action higher. At this point, with upside potential still present, the investor will likely consider the notion of adding to the overall position.
•A smaller candle body with longer wicks: Similar to the doji candlestick formation, this candle suggests a near-term turnaround in the overall trend. Signaling indecision, market participants are likely to wait for further directional bias before pushing the market one way or the other. Traders following on the signal will likely prefer confirmation before initiating any positions.
•Negative candles (red) containing shadows or wicks: Weakness or negative momentum is supporting the price action lower in the market. As a result, traders will want to begin exiting initial long positions or selling positions at this point.
•Negative candles (red) containing no shadows or wicks: Selling momentum is strong and will likely support a move lower in the overall decline. As a result, the trader would do well to add to existing short holdings.
The Heikin Ashi will still take some time to master; however, once this is accomplished, the Heikin Ashi will act to confirm the overall trend of the price action. Now let's see how it is used in market opportunities.
Read more: http://www.investopedia.com/articles/forex/07/heikinashi.asp#ixzz1RStIFZ5D
Source: FX Trek Intellicharts Figure 1: A nearly identical interpretation (top: price action, bottom: Heikin Ashi)


 字體:小 中 大


